Published on
6 May 2022
by
Pritha Bhandari.
Revised on
10 October 2022.
Correlation means there is a statistical association between variables. Causation means that a change in one variable causes a change in another variable.
In research, you might have come across the phrase ‘correlation doesn’t imply causation’. Correlation and causation are two related ideas, but understanding their differences will help you critically evaluate and interpret scientific research.
Published on
6 May 2022
by
Pritha Bhandari
Revised on
16 January 2023.
A Likert scale is a rating scale used to measure opinions, attitudes, or behaviours.
It consists of a statement or a question, followed by a series of five or seven answer statements. Respondents choose the option that best corresponds with how they feel about the statement or question.
Because respondents are presented with a range of possible answers, Likert scales are great for capturing the level of agreement or their feelings regarding the topic in a more nuanced way. However, Likert scales are prone to response bias, where respondents either agree or disagree with all the statements due to fatigue or social desirability.
Likert scales are common in survey research, as well as in fields like marketing, psychology, or other social sciences.
Published on
6 May 2022
by
Pritha Bhandari.
Revised on
10 October 2022.
Operationalisation means turning abstract concepts into measurable observations. Although some concepts, like height or age, are easily measured, others, like spirituality or anxiety, are not.
Through operationalisation, you can systematically collect data on processes and phenomena that aren’t directly observable.
Example: OperationalisationThe concept of social anxiety can’t be directly measured, but it can be operationalised in many different ways. For example:
Self-rating scores on a social anxiety scale
Number of recent behavioural incidents of avoidance of crowded places
Intensity of physical anxiety symptoms in social situations
Published on
5 May 2022
by
Pritha Bhandari.
Revised on
5 December 2022.
A correlational research design investigates relationships between variables without the researcher controlling or manipulating any of them.
A correlation reflects the strength and/or direction of the relationship between two (or more) variables. The direction of a correlation can be either positive or negative.
Positive correlation
Both variables change in the same direction
As height increases, weight also increases
Negative correlation
The variables change in opposite directions
As coffee consumption increases, tiredness decreases
Data collection is a systematic process of gathering observations or measurements. Whether you are performing research for business, governmental, or academic purposes, data collection allows you to gain first-hand knowledge and original insights into your research problem.
While methods and aims may differ between fields, the overall process of data collection remains largely the same. Before you begin collecting data, you need to consider:
The aim of the research
The type of data that you will collect
The methods and procedures you will use to collect, store, and process the data
To collect high-quality data that is relevant to your purposes, follow these four steps.
In research, you often investigate causal relationships between variables using experiments or observations. For example, you might test whether caffeine improves speed by providing participants with different doses of caffeine and then comparing their reaction times.
An explanatory variable is what you manipulate or observe changes in (e.g., caffeine dose).
A response variable is what changes as a result (e.g., reaction times).
The words ‘explanatory variable’ and ‘response variable’ are often interchangeable with other terms used in research.
Published on
4 May 2022
by
Pritha Bhandari.
Revised on
5 December 2022.
In an experiment, an extraneous variable is any variable that you’re not investigating that can potentially affect the outcomes of your research study.
If left uncontrolled, extraneous variables can lead to inaccurate conclusions about the relationship between independent and dependent variables.
Research question
Extraneous variables
Is memory capacity related to test performance?
Test-taking time of day
Test anxiety
Level of stress
Does sleep deprivation affect driving ability?
Road conditions
Years of driving experience
Noise
Does light exposure improve learning ability in mice?
Published on
4 May 2022
by
Pritha Bhandari.
Revised on
16 June 2023.
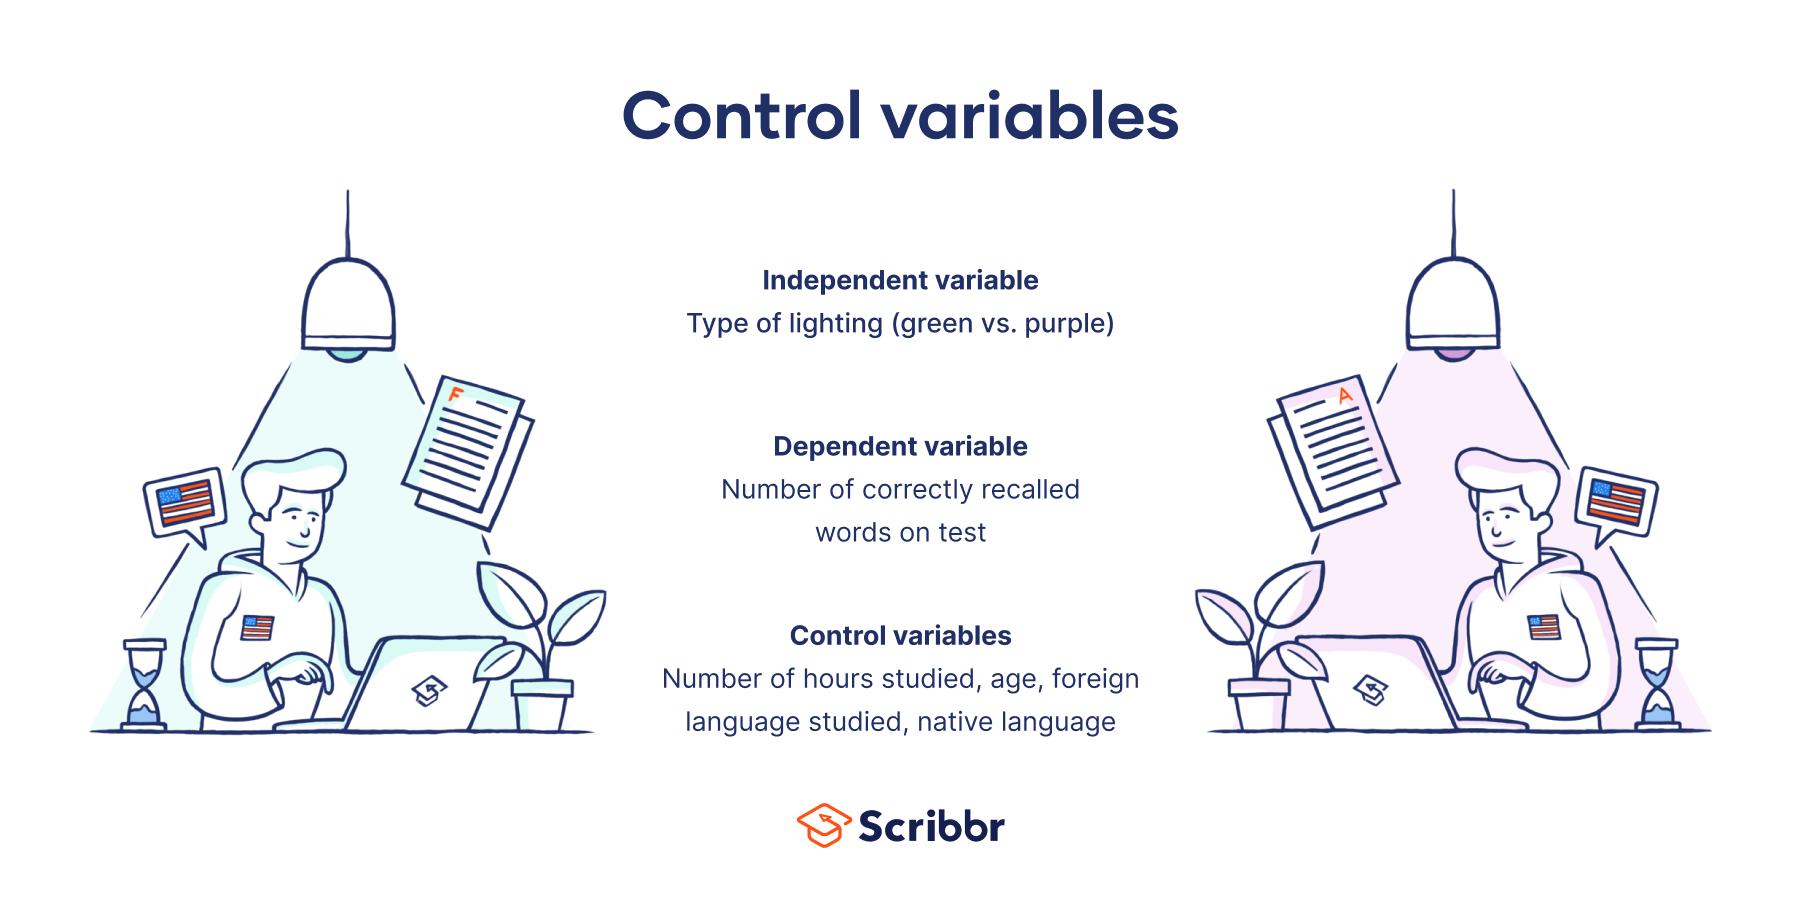
A control variable is anything that is held constant or limited in a research study. It’s a variable that is not of interest to the study’s aims but is controlled because it could influence the outcomes.
Variables may be controlled directly by holding them constant throughout a study (e.g., by controlling the room temperature in an experiment), or they may be controlled indirectly through methods like randomisation or statistical control (e.g., to account for participant characteristics like age in statistical tests).
Examples of control variables
Research question
Control variables
Does soil quality affect plant growth?
Temperature
Amount of light
Amount of water
Does caffeine improve memory recall?
Participant age
Noise in the environment
Type of memory test
Do people with a fear of spiders perceive spider images faster than other people?
A mediating variable (or mediator) explains the process through which two variables are related, while a moderating variable (or moderator) affects the strength and direction of that relationship.
Including mediators and moderators in your research helps you go beyond studying a simple relationship between two variables for a fuller picture of the real world. These variables are important to consider when studying complex correlational or causal relationships between variables.
Published on
4 May 2022
by
Pritha Bhandari.
Revised on
17 October 2022.
In research, variables are any characteristics that can take on different values, such as height, age, temperature, or test scores.
Researchers often manipulate or measure independent and dependent variables in studies to test cause-and-effect relationships.
The independent variable is the cause. Its value is independent of other variables in your study.
The dependent variable is the effect. Its value depends on changes in the independent variable.
Example: Independent and dependent variablesYou design a study to test whether changes in room temperature have an effect on maths test scores.
Your independent variable is the temperature of the room. You vary the room temperature by making it cooler for half the participants, and warmer for the other half.
Your dependent variable is maths test scores. You measure the maths skills of all participants using a standardised test and check whether they differ based on room temperature.