While descriptive statistics summarise the characteristics of a data set, inferential statistics help you come to conclusions and make predictions based on your data.
When you have collected data from a sample, you can use inferential statistics to understand the larger population from which the sample is taken.
Inferential statistics have two main uses:
making estimates about populations (for example, the mean SAT score of all 11th graders in the US).
testing hypotheses to draw conclusions about populations (for example, the relationship between SAT scores and family income).
The geometric mean is an average that multiplies all values and finds a root of the number. For a dataset with n numbers, you find the nth root of their product. You can use this descriptive statistic to summarise your data.
The geometric mean is an alternative to the arithmetic mean, which is often referred to simply as ‘the mean‘. While the arithmetic mean is based on adding values, the geometric mean multiplies values.
Published on
3 January 2023
by
Pritha Bhandari.
Revised on
10 February 2023.
In a normal distribution, data is symmetrically distributed with no skew. When plotted on a graph, the data follows a bell shape, with most values clustering around a central region and tapering off as they go further away from the center.
Normal distributions are also called Gaussian distributions or bell curves because of their shape.
Published on
1 January 2023
by
Pritha Bhandari.
Revised on
19 January 2023.
The median is the value that’s exactly in the middle of a dataset when it is ordered. It’s a measure of central tendency that separates the lowest 50% from the highest 50% of values.
The steps for finding the median differ depending on whether you have an odd or an even number of data points. If there are two numbers in the middle of a dataset, their mean is the median.
The median is usually used with quantitative data (where the values are numerical), but you can sometimes also find the median for an ordinal dataset (where the values are ranked categories).
Measures of central tendency help you find the middle, or the average, of a dataset. The 3 most common measures of central tendency are the mode, median, and mean.
Published on
31 December 2022
by
Pritha Bhandari.
Revised on
27 February 2025.
The mean (aka the arithmetic mean, different from the geometric mean) of a dataset is the sum of all values divided by the total number of values. It’s the most commonly used measure of central tendency and is often referred to as the ‘average’.
Published on
5 November 2022
by
Pritha Bhandari.
Revised on
19 January 2023.
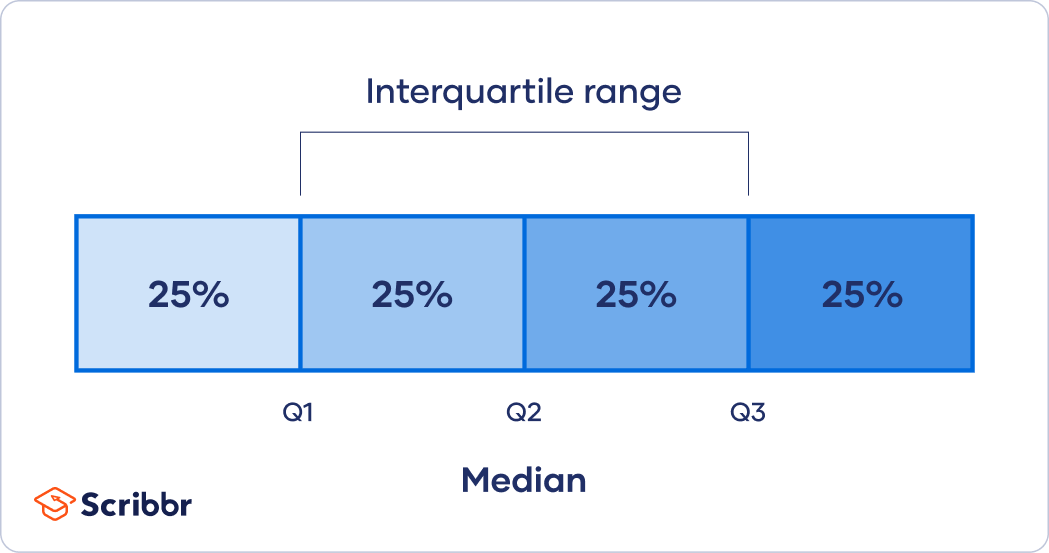
In descriptive statistics, the interquartile range tells you the spread of the middle half of your distribution.
Quartiles segment any distribution that’s ordered from low to high into four equal parts. The interquartile range (IQR) contains the second and third quartiles, or the middle half of your data set.
Whereas the range gives you the spread of the whole data set, the interquartile range gives you the range of the middle half of a data set.
Published on
4 November 2022
by
Pritha Bhandari.
Revised on
19 January 2023.
The mode or modal value of a data set is the most frequently occurring value. It’s a measure of central tendency that tells you the most popular choice or most common characteristic of your sample.
When reporting descriptive statistics, measures of central tendency help you find the middle or the average of your data set. The three most common measures of central tendency are the mode, median, and mean.