Published on
4 November 2022
by
Pritha Bhandari.
Revised on
9 January 2023.
Descriptive statistics summarise and organise characteristics of a data set. A data set is a collection of responses or observations from a sample or entire population.
In quantitative research, after collecting data, the first step of statistical analysis is to describe characteristics of the responses, such as the average of one variable (e.g., age), or the relation between two variables (e.g., age and creativity).
The next step is inferential statistics, which help you decide whether your data confirms or refutes your hypothesis and whether it is generalisable to a larger population.
Published on
4 October 2022
by
Pritha Bhandari.
Revised on
17 January 2024.
Outliers are extreme values that differ from most other data points in a dataset. They can have a big impact on your statistical analyses and skew the results of any hypothesis tests.
It’s important to carefully identify potential outliers in your dataset and deal with them in an appropriate manner for accurate results.
Missing data, or missing values, occur when you don’t have data stored for certain variables or participants. Data can go missing due to incomplete data entry, equipment malfunctions, lost files, and many other reasons.
In any dataset, there are usually some missing data. In quantitative research, missing values appear as blank cells in your spreadsheet.
Published on
30 September 2022
by
Pritha Bhandari.
Revised on
17 March 2023.
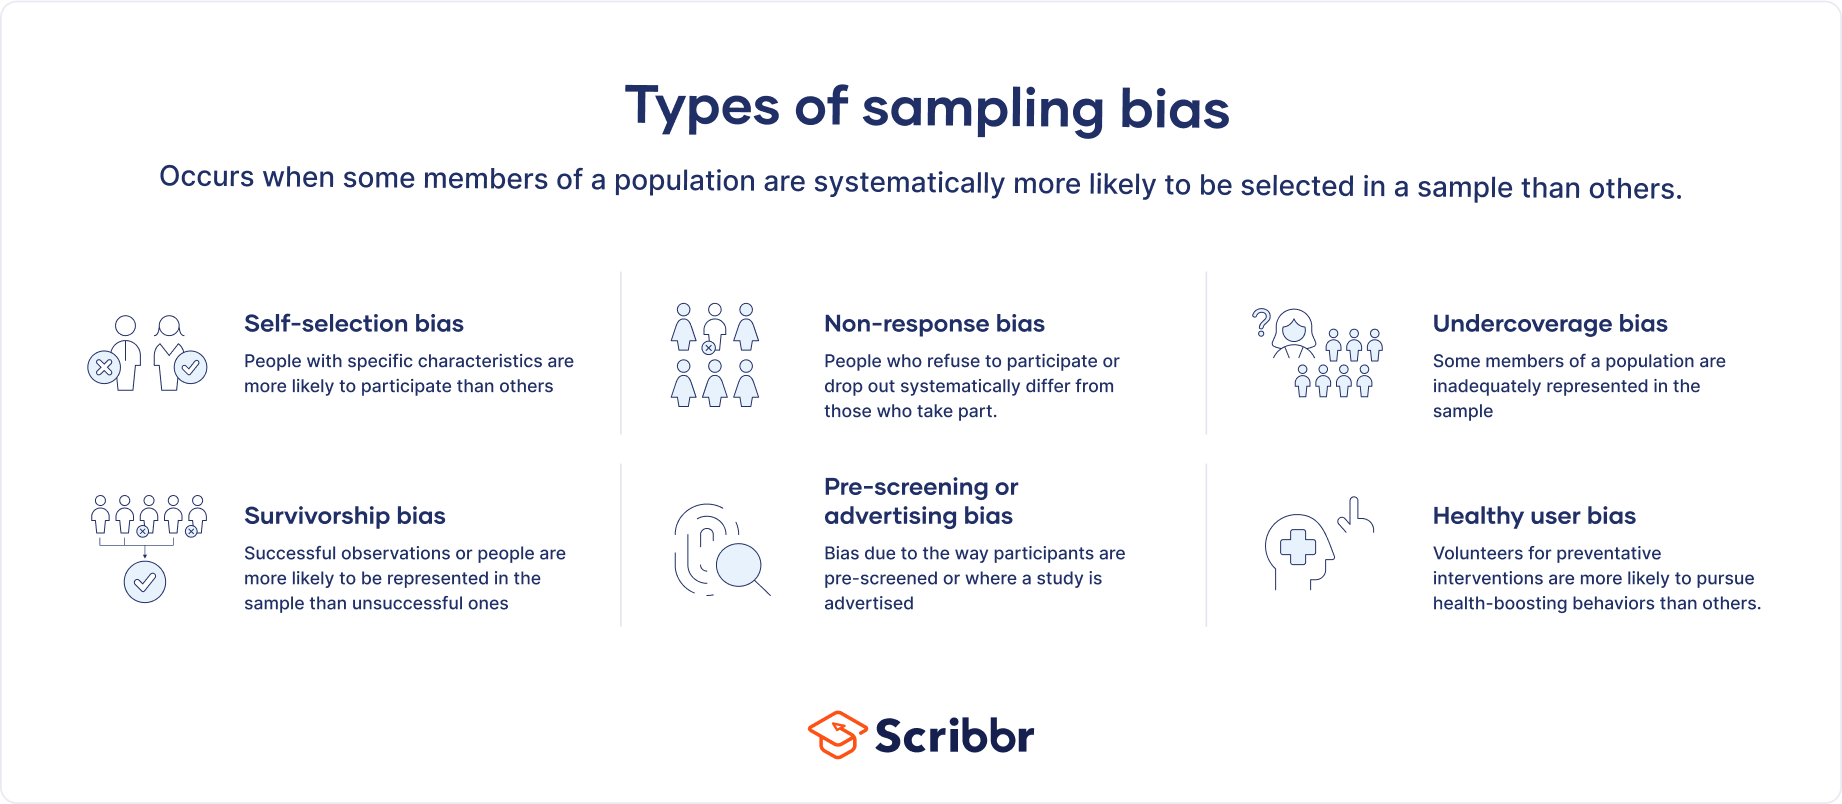
Sampling bias occurs when some members of a population are systematically more likely to be selected in a sample than others. It is also called ascertainment bias in medical fields.
Sampling bias limits the generalisability of findings because it is a threat to external validity, specifically population validity. In other words, findings from biased samples can only be generalised to populations that share characteristics with the sample.
Published on
26 September 2022
by
Pritha Bhandari.
Revised on
19 January 2023.
In statistics, the range is the spread of your data from the lowest to the highest value in the distribution. It is a commonly used measure of variability.
The range is calculated by subtracting the lowest value from the highest value. While a large range means high variability, a small range means low variability in a distribution.
Published on
26 September 2022
by
Pritha Bhandari.
Revised on
28 March 2024.
The standard deviation is the average amount of variability in your dataset. It tells you, on average, how far each value lies from the mean.
A high standard deviation means that values are generally far from the mean, while a low standard deviation indicates that values are clustered close to the mean.
Variability describes how far apart data points lie from each other and from the center of a distribution. Along with measures of central tendency, measures of variability give you descriptive statistics that summarise your data.
Variability is also referred to as spread, scatter or dispersion. It is most commonly measured with the following:
Range: the difference between the highest and lowest values
Ordinal data is classified into categories within a variable that have a natural rank order. However, the distances between the categories are uneven or unknown.
For example, the variable ‘frequency of physical exercise’ can be categorised into the following:
1. Never
2. Rarely
3. Sometimes
4. Often
5. Always
There is a clear order to these categories, but we cannot say that the difference between ‘never’ and ‘rarely’ is exactly the same as that between ‘sometimes’ and ‘often’. Therefore, this scale is ordinal.
Interval data is measured along a numerical scale that has equal distances between adjacent values. These distances are called ‘intervals’.
There is no true zero on an interval scale, which is what distinguishes it from a ratio scale. On an interval scale, zero is an arbitrary point, not a complete absence of the variable.
Common examples of interval scales include standardised tests, such as the SAT, and psychological inventories.