How to Find the Mean | Definition, Examples & Calculator
The mean (aka the arithmetic mean, different from the geometric mean) of a dataset is the sum of all values divided by the total number of values. It’s the most commonly used measure of central tendency and is often referred to as the ‘average’.
Arithmetic mean calculator
You can calculate the mean by hand or with the help of our arithmetic mean calculator below.
Mean formulas for populations and samples
In research, you often collect data from samples and perform inferential statistics to understand the population they came from.
The formulas for the sample mean and the population mean only differ in mathematical notation. Population attributes use capital letters while sample attributes use lowercase letters.
Population mean
| Population mean formula | Explanation |
|---|---|
 |
|
 = population mean
 = sum of each value in the population
 = number of values in the population
The population mean can also be denoted as μ.
Sample mean
| Sample mean formula | Explanation |
|---|---|
 |
|
The sample mean is also referred to as M.
Steps for calculating the mean
There are two steps for calculating the mean:
- Add up all the values in the data set.
- Divide this number by the number of values.
We’ll walk through these steps with a sample data set.
Let’s say you want to find the average amount people spend on a restaurant meal in your neighborhood. You ask a sample of 8 neighbors how much they spent the last time they went out for dinner, and find the mean cost.
| Cost of dinner for two (USD) | 42 | 13 | 31 | 87 | 24 | 58 | 76 | 69 |
|---|
Step 1: Find the sum of the values by adding them all up
Because we’re working with a sample, we use the sample formula.
| Formula | Calculation |
|---|---|
 |
42 + 13 + 31 + 87 + 24 + 58 + 76 + 69 = 400 |
Step 2: Divide the sum by the number of values
In the formula, n is the number of values in your data set. Our data set has 8 values.
| Formula | Calculation |
|---|---|
 |
 = 8 = 400 = 8 = 400 = 400 = 400  8 = 50 8 = 50 |
The mean tells us that in our sample, participants spent an average of 50 USD on their restaurant bill.
Outlier effect on the mean
Outliers are extreme values that differ from most values in the data set. Because all values are used in the calculation of the mean, an outlier can have a dramatic effect on the mean by pulling the mean away from the majority of the values.
Let’s see what happens to the mean when we add an outlier to our data set.
| Cost of dinner for two (USD) | 42 | 13 | 31 | 87 | 24 | 58 | 76 | 69 | 230 |
|---|
Step 1: Find the sum of the values by adding them all up
| Formula | Calculation |
|---|---|
|
42 + 13 + 31 + 87 + 24 + 58 + 76 + 69 + 230 = 630 |
Step 2: Divide the sum by the number of values
| Formula | Calculation |
|---|---|
|
= 9 = 630 = 630 9 = 70 |
As we can see, adding just one outlier to our data set raised the mean by 20 USD. In this case, a different measure of central tendency, like the median, would be more appropriate.
When can you use the mean, median or mode?
The mean is the most widely used measure of central tendency because it uses all values in its calculation. The best measure of central tendency depends on your type of variable and the shape of your distribution.
Type of variable
The mean can only be calculated for quantitative variables (e.g., height), and it can’t be found for categorical variables (e.g., gender).
In categorical variables, data is placed into groupings without exact numerical values, so the mean cannot be calculated. For categorical variables, the mode is the best measure of central tendency because it tells you the most common characteristic or popular choice for your sample.
But for continuous or discrete variables, you have exact numerical values. With these, you can easily calculate the mean or median.
Distribution shape
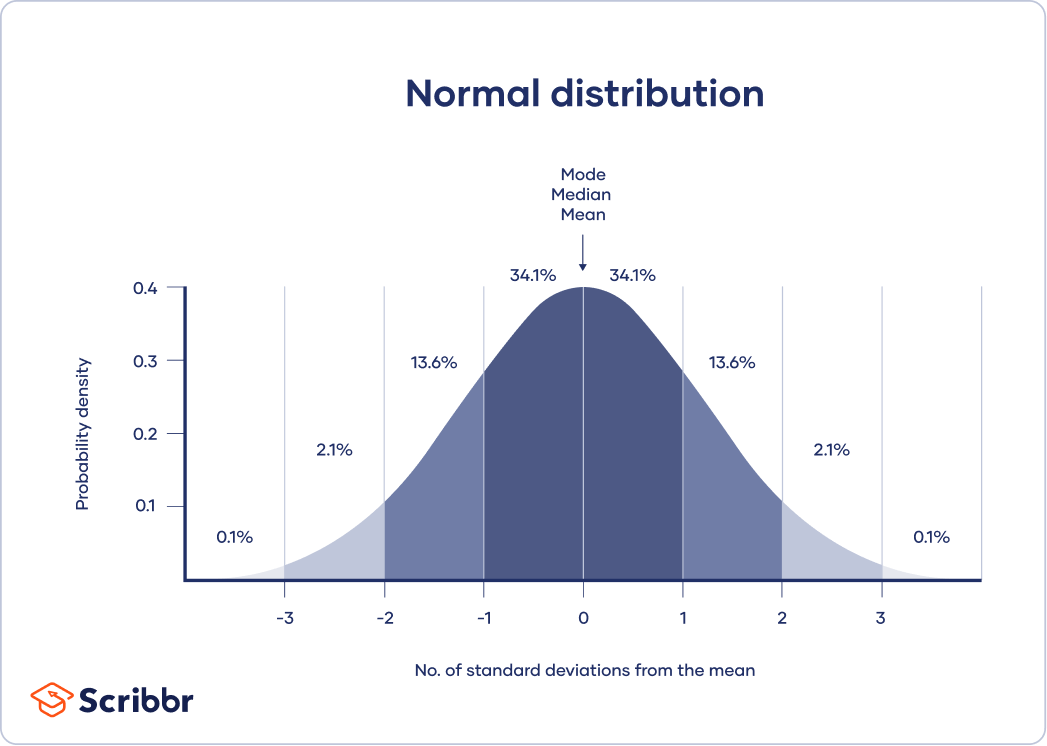
The mean is best for data sets with normal distributions. In a normal distribution, data is symmetrically distributed with no skew. Most values cluster around a central region, with values tapering off as they go further away from the center.
The mean, mode and median are exactly the same in a normal distribution.
In skewed distributions, more values fall on one side of the center than the other, and the mean, median and mode all differ from each other. One side has a more spread out and longer tail with fewer scores at one end than the other.
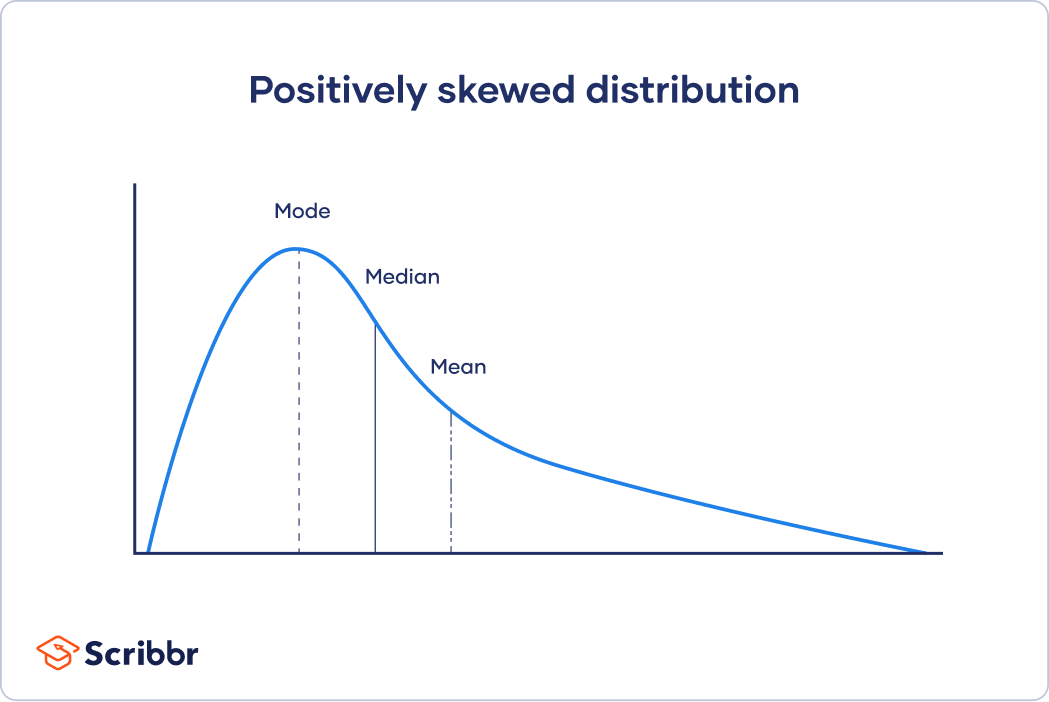
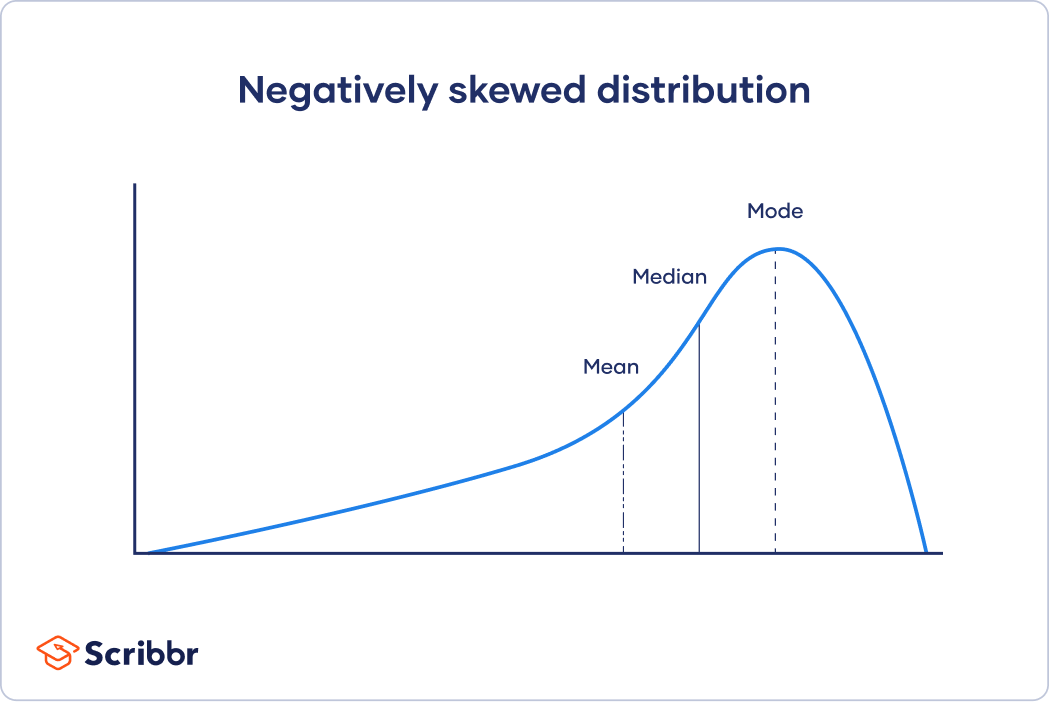
For skewed distributions and distributions with outliers, the mean is easily influenced by extreme values and may not accurately represent the central tendency. The median is a better measure for these distributions as it takes a value from the middle of the distribution.
Alternatively, you can systematically review and remove outliers from your dataset in the data cleansing process.
Frequently asked questions
Cite this Scribbr article
If you want to cite this source, you can copy and paste the citation or click the ‘Cite this Scribbr article’ button to automatically add the citation to our free Reference Generator.
Bhandari, P. (2025, February 27). How to Find the Mean | Definition, Examples & Calculator. Scribbr. Retrieved 20 June 2026, from https://www.scribbr.co.uk/stats/mean-statistics/