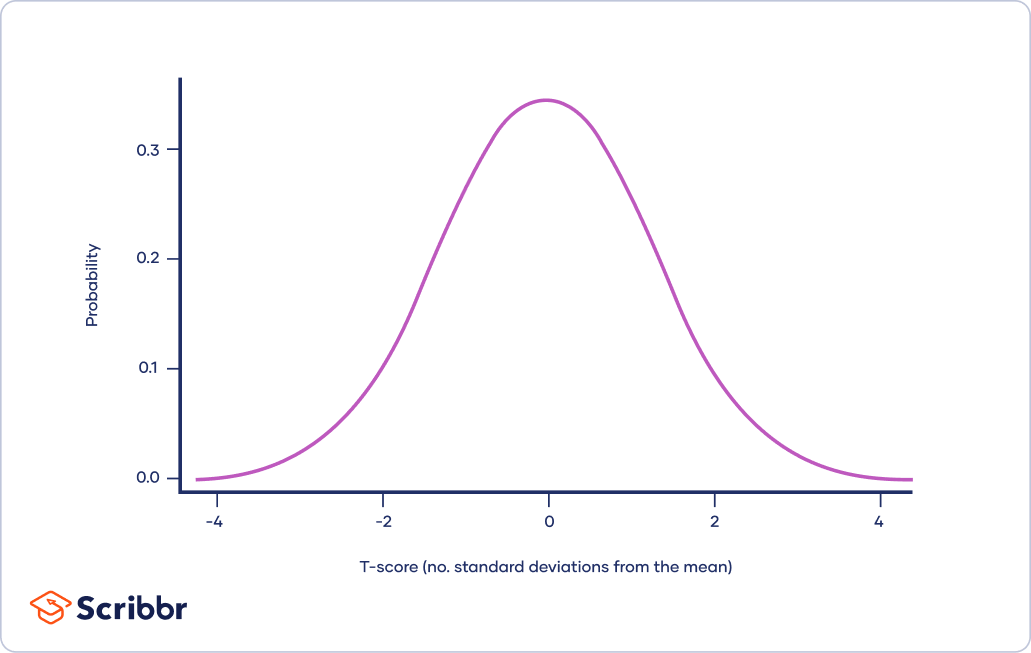
The t-distribution, also known as Student’s t-distribution, is a way of describing data that follow a bell curve when plotted on a graph, with the greatest number of observations close to the mean and fewer observations in the tails.
It is a type of normal distribution used for smaller sample sizes, where the variance in the data is unknown.
In statistics, the t-distribution is most often used to:
Find the critical values for a confidence interval when the data is approximately normally distributed.
When you make an estimate in statistics, whether it is a summary statistic or a test statistic, there is always uncertainty around that estimate because the number is based on a sample of the population you are studying.
The confidence interval is the range of values that you expect your estimate to fall between a certain percentage of the time if you run your experiment again or re-sample the population in the same way.
The confidence level is the percentage of times you expect to reproduce an estimate between the upper and lower bounds of the confidence interval, and is set by the alpha value.
Published on
19 September 2022
by
Rebecca Bevans.
Revised on
28 November 2022.
In statistical research, a variable is defined as an attribute of an object of study. Choosing which variables to measure is central to good experimental design.
Example: VariablesIf you want to test whether some plant species are more salt-tolerant than others, some key variables you might measure include the amount of salt you add to the water, the species of plants being studied, and variables related to plant health like growth and wilting.
You need to know which types of variables you are working with in order to choose appropriate statistical tests and interpret the results of your study.
You can usually identify the type of variable by asking two questions:
Experimental design means creating a set of procedures to systematically test a hypothesis. A good experimental design requires a strong understanding of the system you are studying.
There are five key steps in designing an experiment:
Consider your variables and how they are related
Write a specific, testable hypothesis
Design experimental treatments to manipulate your independent variable
Assign subjects to groups, either between-subjects or within-subjects
Plan how you will measure your dependent variable
For valid conclusions, you also need to select a representative sample and control any extraneous variables that might influence your results. If if random assignment of participants to control and treatment groups is impossible, unethical, or highly difficult, consider an observational study instead.